
WorkDeveloper tooling
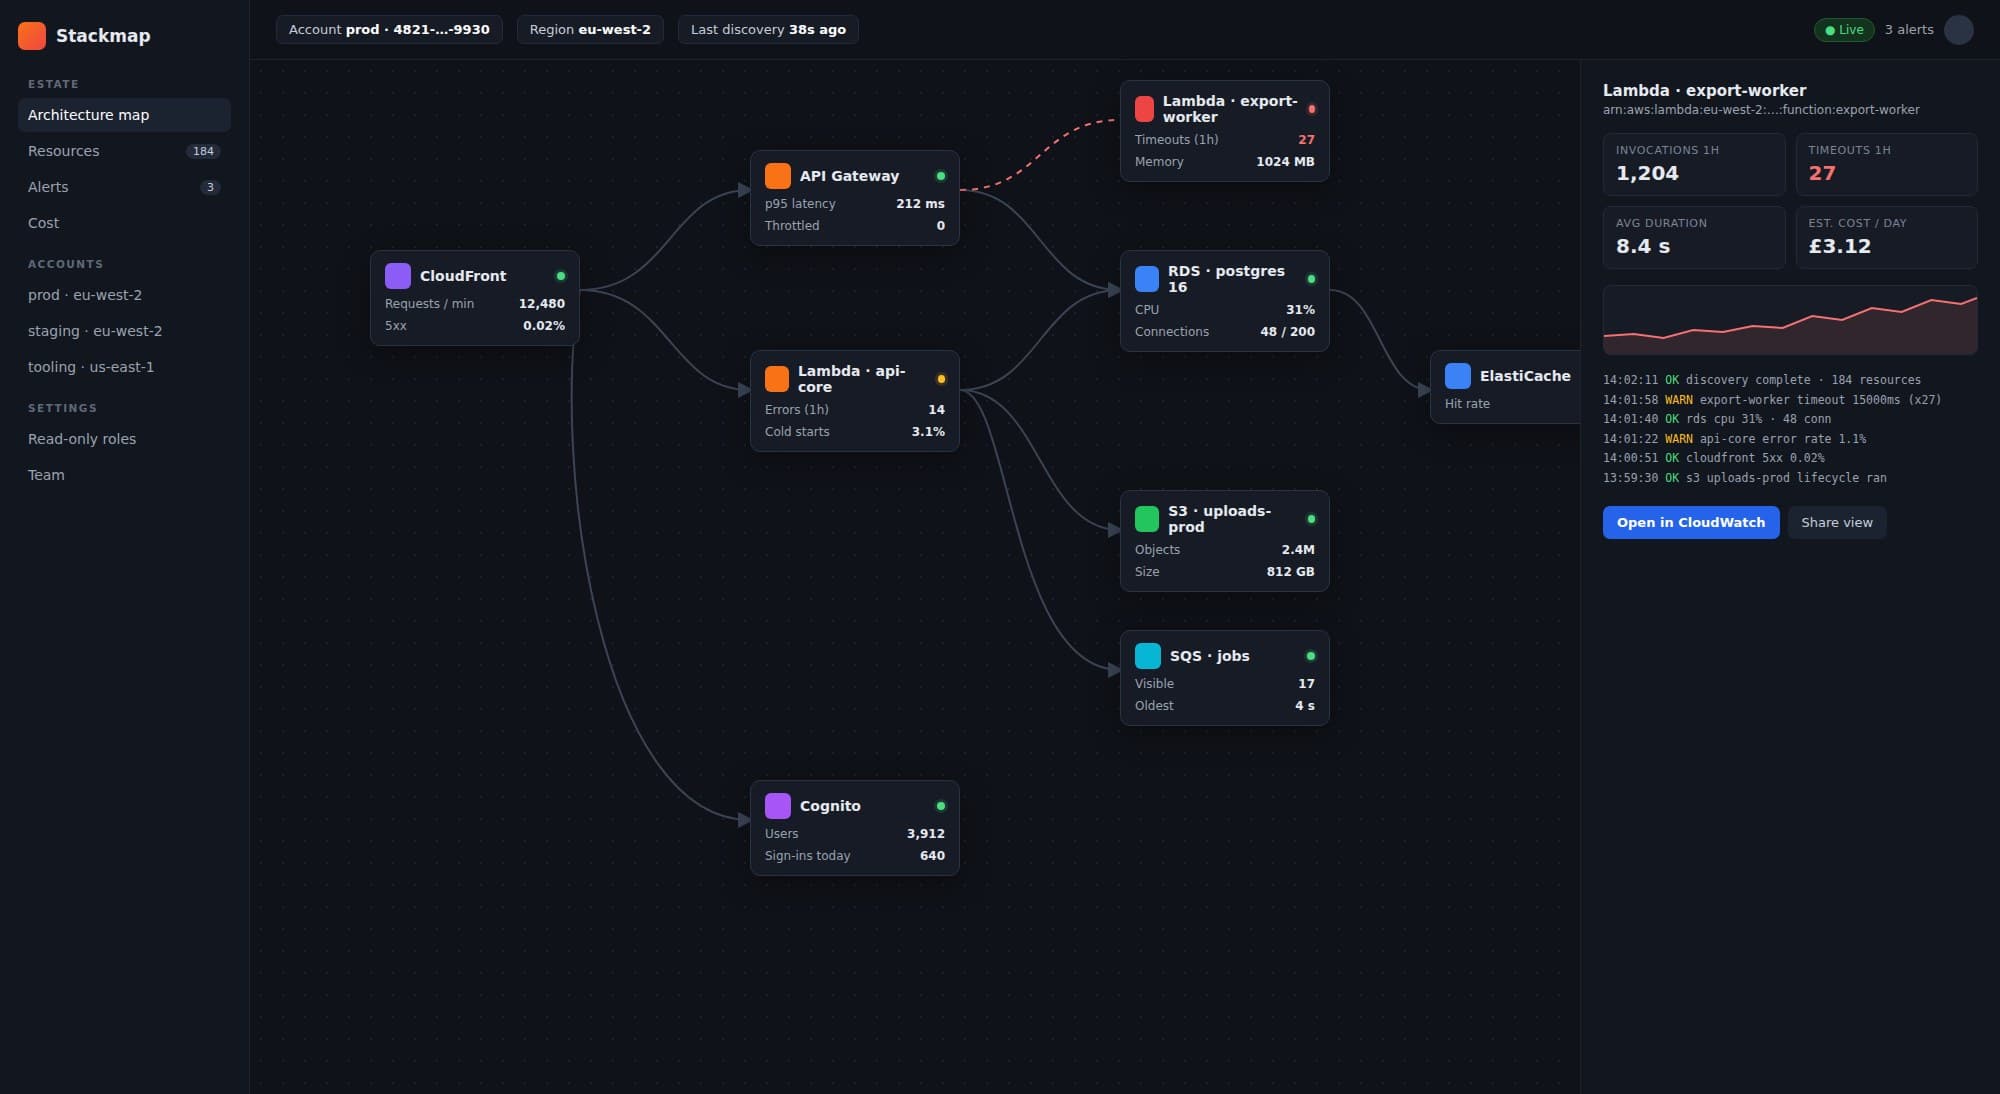
An interactive map of a company's AWS estate that replaced clicking around the console, with live health on every node.
- Client
- Cloud infrastructure startup
- Year
- 2025
- Status
- Client approved
- Services
- Web applications, Cloud & DevOps
- Stack
- React, React Flow, AWS SDK, Node.js
cloud-infrastructure-startup.app
The story
01The problem
The team knew their infrastructure only through the AWS console and a diagram that was six months out of date. Incidents meant tab hunting.
02What we built
A dashboard that discovers resources through the SDK, lays them out as a graph and overlays health and cost. Click a node, see its metrics. Nothing to install in the account beyond a read only role.
- Live service health across S3, Lambda, RDS and CloudFront
- Architecture and connections drawn automatically with React Flow
- Data pulled straight from the AWS SDK, no agents to install
- Shareable read only views for non engineers
03What changed
Signed off by the client and used during incidents. The diagram is finally never out of date.